
Page 179 - VERITAS Vol.2 Issue 2
P. 179
From the figure 4.1, 99% of the subjects’ writing samples were clearly
visible, indicating that the writing is legible when done in a slow speed
S1. Only 1% of the subjects’ writing had some words that were unclear,
which were subsequently classified as moderately legible.
Chart Title
20%
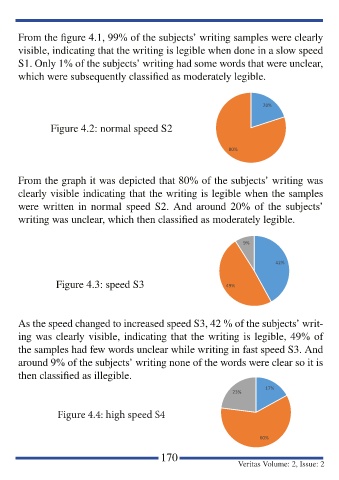
Figure 4.2: normal speed S2
80%
From the graph it was depicted that 80% of the subjects’ writing was
1
2
clearly visible indicating that the writing is legible when the samples
were written in normal speed S2. And around 20% of the subjects’
writing was unclear, which then classified as moderately legible.
Chart Title
9%
42%
Figure 4.3: speed S3 49%
As the speed changed to increased speed S3, 42 % of the subjects’ writ-
1
2
3
ing was clearly visible, indicating that the writing is legible, 49% of
the samples had few words unclear while writing in fast speed S3. And
Chart Title
around 9% of the subjects’ writing none of the words were clear so it is
then classified as illegible.
17%
23%
Figure 4.4: high speed S4
60%
170
Veritas Volume: 2, Issue: 2
3
2
1